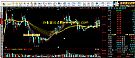
尘隐均线是由两组均线构成,它能够反映市场中长期投资者的行为。当两组均线相互靠近时,买入;而当它们相互远离时,卖出。一旦两组均线同时出现了价咯方向的一致变化,则是机会。 MA1:EMA(C,3),colorgreen; MA2:EMA(C,5),colorwhite; MA3:EMA(C,8),colorwhite; MA4:EMA(C,10),colorwhite; MA5:EMA(C,12),colorwhite; MA6:EMA(C,15),colorwhite; MA7:EMA(C,30),colorred; MA8:EMA(C,35),coloryellow; MA9:EMA(C,40),coloryellow; MA10:EMA(C,45),coloryellow; MA11:EMA(C,50),coloryellow; MA12:EMA(C,60),coloryellow; STICKLINE(C<0.905*REF(C,1),C,O,5,0),colorwhite; STICKLINE(C>1.095*REF(C,1),C,O,5,0),coloryellow; |