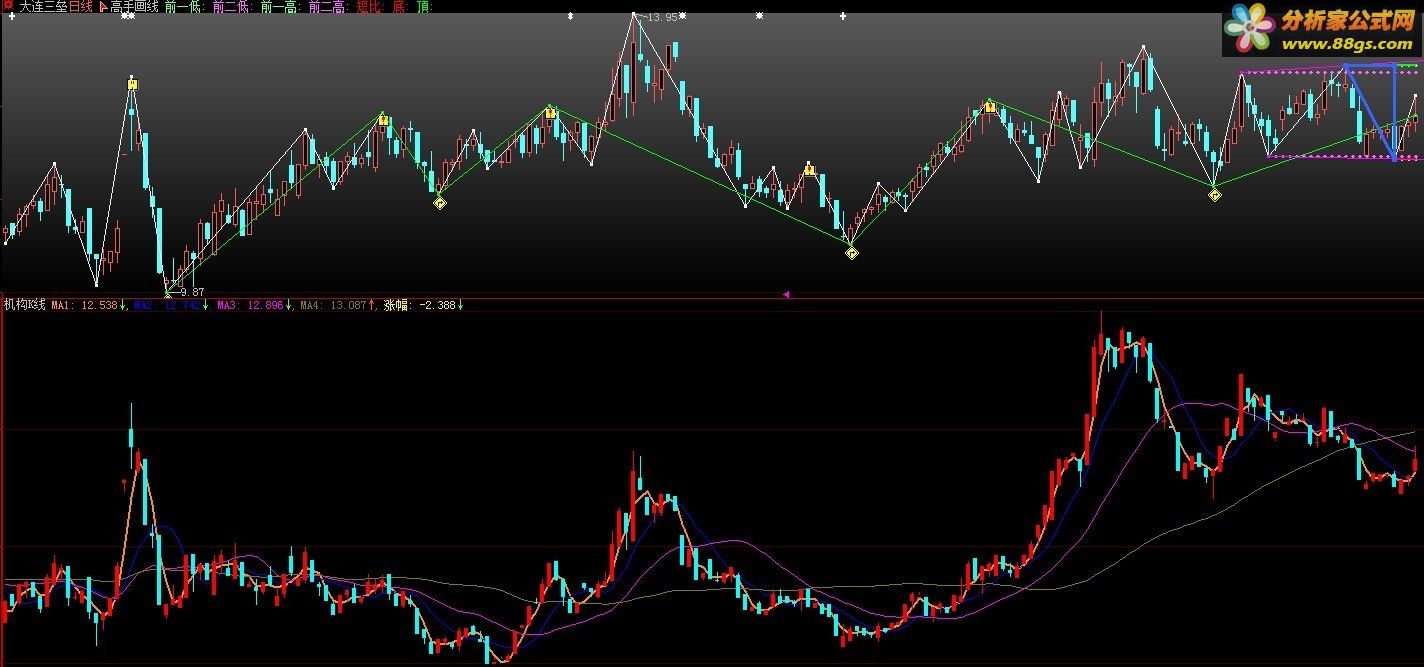
机构K线表现的是股票对比指数,实际的强弱,代表股票的真实位置和表现 c1:=10000*close/indexc; h1:=10000*high/indexh; l1:=10000*low/indexl; o1:=10000*open/indexo; STICKLINE(c1>=o1,c1,o1,6,0.2),COLORRED; STICKLINE(c1>=o1,l1,h1,0.2,0.2),COLORRED; STICKLINE(c1<o1,c1,o1,6,0.2),colorcyan; STICKLINE(c1<o1,l1,h1,0.2,0.2),colorcyan; MA1:MA(C1,3),color208fff,linethick2; MA2:MA(C1,8); MA3:MA(C1,20); MA4:MA(C1,55); 涨幅:(c1-REF(c1,1))*100/REF(c1,1),POINTDOT,COLORyellow,LINETHICK0; |