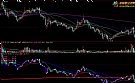
说明:本来只是用来观察量价比的,后来加了三条变色均线(19天,46天,886天),发现用来观察涨跌不错,特发给大家共享,看图就明白了。 cjlb:=(AMOUNT-ref(amount,1))/ref(amount,1); cjjb:=(close-ref(close,1))/ref(close,1); STICKLINE(cjlb>=0 and cjjb>=0 and cjjb>=cjlb,ref(close,1),CLOSE,8,0),colorred; STICKLINE(cjlb>=0 and cjjb>=0 and cjlb>cjjb,ref(close,1),CLOSE,8,0),colorff00ff; STICKLINE(cjlb>=0 and cjjb<0,ref(close,1),CLOSE,8,0),colorblue; STICKLINE(cjlb<0 and cjjb<0,ref(close,1),CLOSE,8,0),colorffff00; STICKLINE(cjlb<0 and cjjb>=0,ref(close,1),CLOSE,8,0),coloryellow; DRAWTEXTREL(4,50,'价升>量增 ---红 色'),colorred; DRAWTEXTREL(4,120,'价升<量增 ---粉红色'),colorff00ff; DRAWTEXTREL(4,190,'价升,量缩 ---黄 色'),coloryellow; DRAWTEXTREL(4,260,'价跌,量缩 ---天蓝色'),colorffff00; DRAWTEXTREL(4,330,'价跌,量增 ---蓝 色'),colorblue; PARTLINE(ma(close,N),ma(close,N)>=REF(ma(close,N),1),RGB(255,0,0),ma(close,N)<REF(ma(close,N),1),RGB(0,255,0)),Linethick1; PARTLINE(ma(close,M),ma(close,M)>=REF(ma(close,M),1),RGB(255,0,0),ma(close,M)<REF(ma(close,M),1),RGB(0,0,255)),Linethick2; PARTLINE(ma(close,P),ma(close,P)>=REF(ma(close,P),1),RGB(255,0,0),ma(close,P)<REF(ma(close,P),1),RGB(0,255,0)),Linethick3; |