DRAWGBK(C>0, RGB(0,10,10),RGB(88,0,0),0,'11',0);
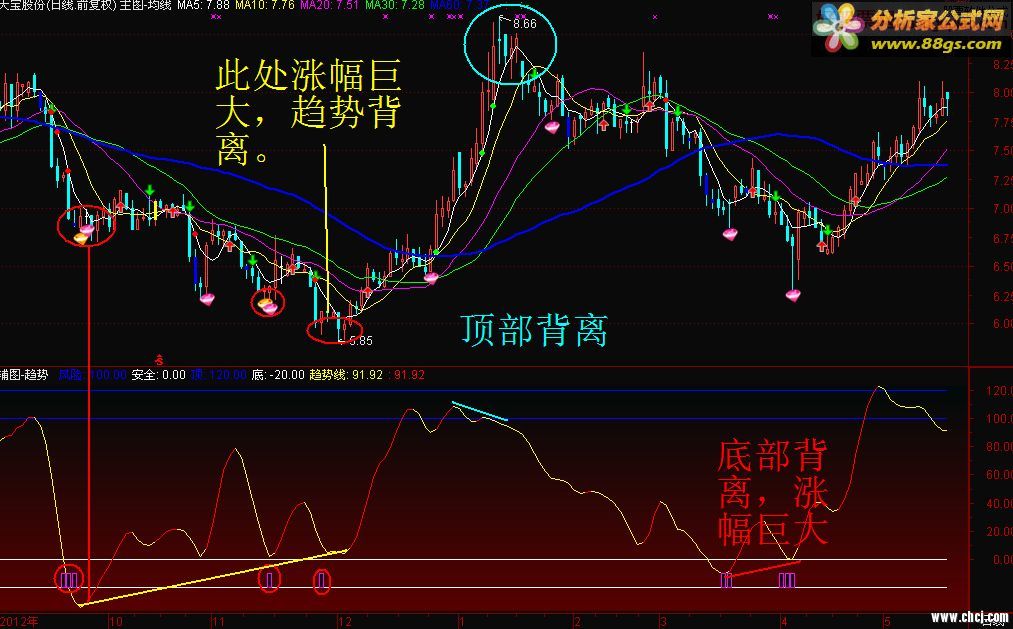
����:100,COLORBLUE;
��ȫ:0,COLORWHITE;
��:120,COLORBLUE;
��:-20,COLORWHITE;
����001:=(5)*(SMA(((CLOSE-LLV(LOW,27))/(HHV(HIGH,27)-LLV(LOW,27)))*(100),5,1))-(3)*(SMA(SMA(((CLOSE-LLV(LOW,27))/(HHV(HIGH,27)-LLV(LOW,27)))*(100),5,1),3,1))-SMA(SMA(SMA(((CLOSE-LLV(LOW,27))/(HHV(HIGH,27)-LLV(LOW,27)))*(100),5,1),3,1),2,1);
������:MA(����001,3),COLORYELLOW,LINETHICK1;
����:=������>REF(������,1);
IF(����,������,DRAWNULL),COLORRED,LINETHICK1;
����A01:=SUM(MAX(MAX((HIGH - LOW),ABS((HIGH - REF(CLOSE,1)))),ABS((LOW - REF(CLOSE,1)))),5);
����A02:=(HIGH - REF(HIGH,1));
����A03:=(REF(LOW,1) - LOW);
����A04:=(SUM(IF(((����A02 > 0) AND ( ����A02 > ����A03)), ����A02,0),5) );
����A:=(((����A04 ) * 100) / ����A01);
����B01:=(H+L+C)/3;
����B02:=HHV(����B01,15);
����B03:=LLV(����B01,15);
����B04:=����B02-����B03;
����B:=MA((����B01-����B03)/����B04,2)*100;
�ײ�:=����A=0 AND ����B=0;
STICKLINE(�ײ�,-20,-10,2,1),COLORF00FF0; |